
Reputation.com Interactive Data Portal Product Design
User experience/interaction/visual design and product management for a customer experience data science platform

Reputation.com is a customer experience (CX) data science platform that helps business owners and brands identify and understand the visibility, sentiment, and engagement consumers have with their organizations in order to better serve their customers.
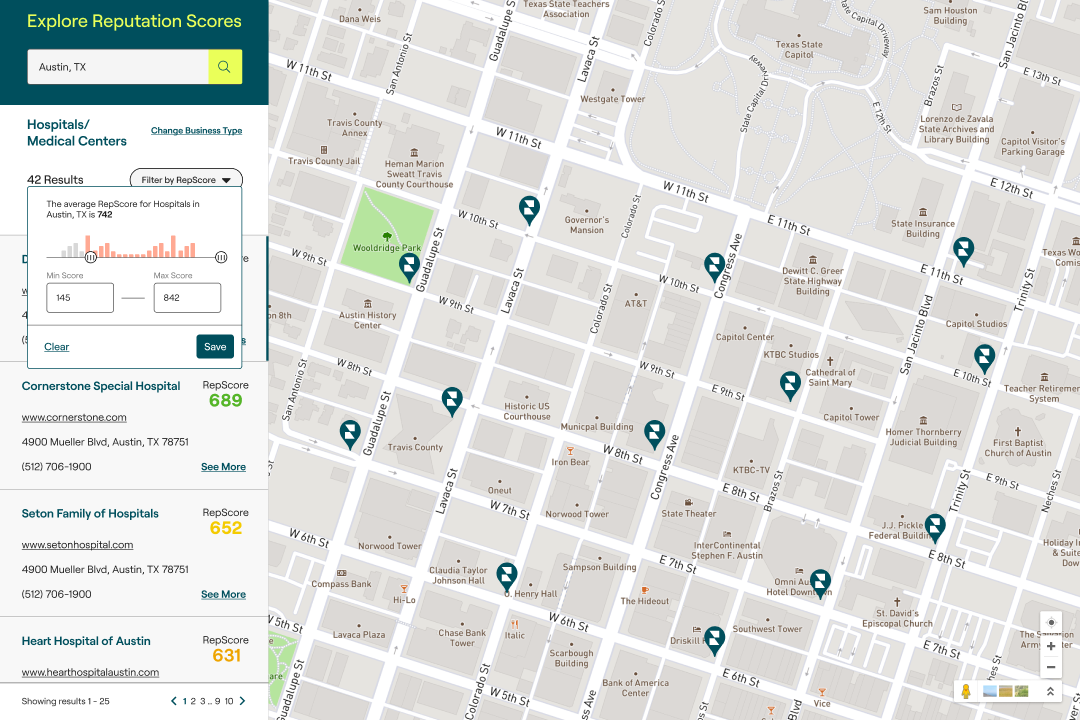
As part of my contractor work with Tallwave as a Senior Product Designer, I worked on the RepScore portal, which includes an interactive map showing business locations and displaying details about these visibility, engagement, and sentiment - factored into one Reputation Score that measures how customers perceive businesses. I worked on defining the user stories through discovery meetings with the client, tracking user stories in JIRA, low-fidelity concept ideation, high-fidelity visual design, and performed quality assurance of front-end development builds to ensure that design standards were met. Design was completed within 5 weeks, with development adding another two.
My Roles
Product Management
User Flows
Wireframes/UI Design
Prototyping
Design Review of Front-End Development builds
Tools
Sketch
InVision
Illustrator
JIRA
Discovery
Reputation.com was initially very succinct in laying out their product goals and desired aesthetic in a project document that indicated desired functionality as well as their desired aesthetic, which included several elements from Airbnb and Google Maps. Their goal was for business owners to be able to view detailed metrics on how their customers perceived them, as well as how their competitors were perceived with a goal of bettering their customer service.
To further refine the project for an agreed SOW, I conducted discovery sessions with Reputation and asked questions that helped us prioritize functionality to be built for the MVP vs. future iterations, and created a moodboard to help guide the project’s design aesthetic. Elements like color and typography came from Reputation’s brand guidelines, however most other components were created from scratch, and iconography was pulled from the Material UI and FontAwesome libraries.

MVP Definition
After multiple discovery and scoping sessions with the client, we decided on the functionality for the MVP based on the client’s timeline and budget, which included the following:
Ability to search by industry type and location, or by business name. The 3 industry types defined for the MVP included Auto Dealerships, Apartments, and Hospitals, with future additions planned.
Ability to filter by Reputation Score points on a range from 0-1000. Other parameters for filtering, such as subgroups and business size, were identified for future iterations.
Ability to scroll through results or click on map points to display summary information.
Ability to view Reputation Score details about business perception, as well as additional metrics once a lead generation form for scheduling demos was filled out.
Ability for business owners to claim their business profile, receive notifications about their business’ score, and leave a note for Reputation if their business wasn’t listed.
I was responsible for distilling these into user stories, writing acceptance criteria, and tracking the stories in JIRA based on mine and the development team’s work completion.
User Flows
The main user flows for the MVP for this portal exist for 3 areas:
The search functionality, which allows a user to search by specifying an industry type and location, or searching for a specific business
The portal displaying search results, from which a user could view a business’ Reputation Score profile and additional details, claim their business profile, filter or alter the search results with new keywords, or sign up for a demo to gain access to additional metrics
The map itself, with which users could adjust the map parameters and refresh their search results to the updated area, or view summary details of a business profile by clicking on a map location.
Search Functionality User Flow

Search Results/Business Profile User Flow
Map Interactions User Flow


Hand Sketches
While I had enough direction and requirements gathered to immediately start wireframing, I used sketching to confirm the correct visual hierarchy of information before translating it digitally.
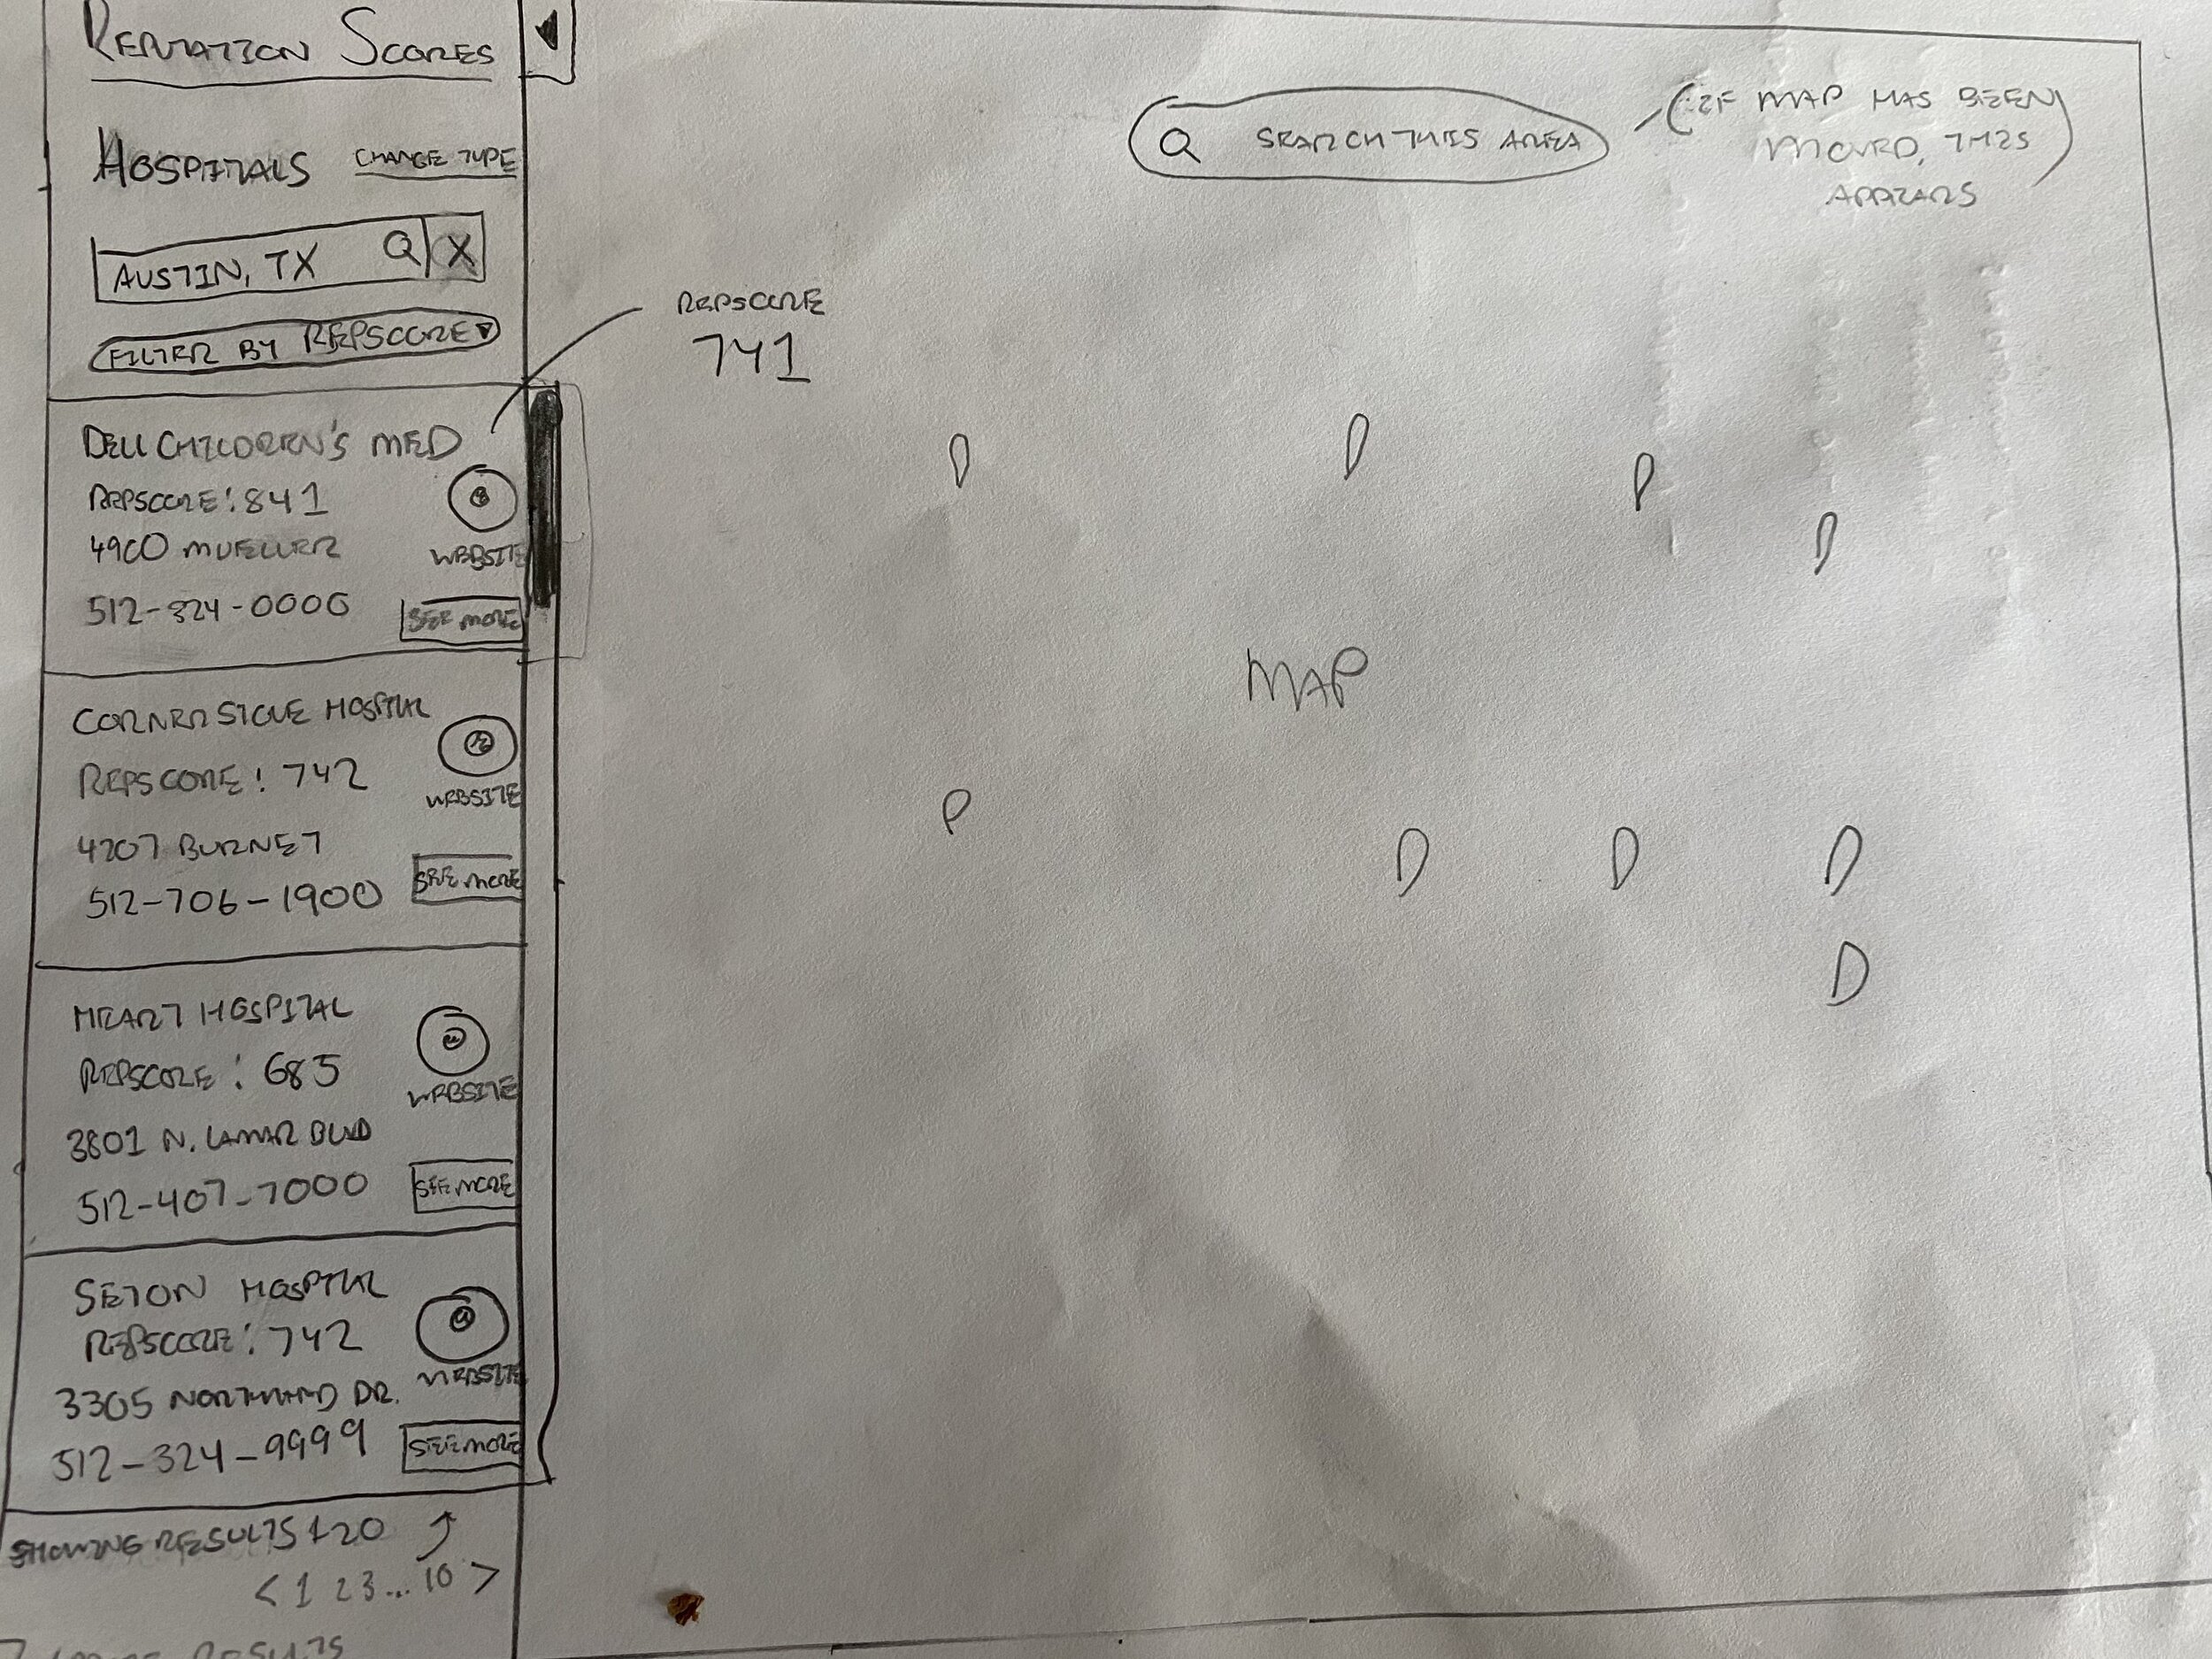
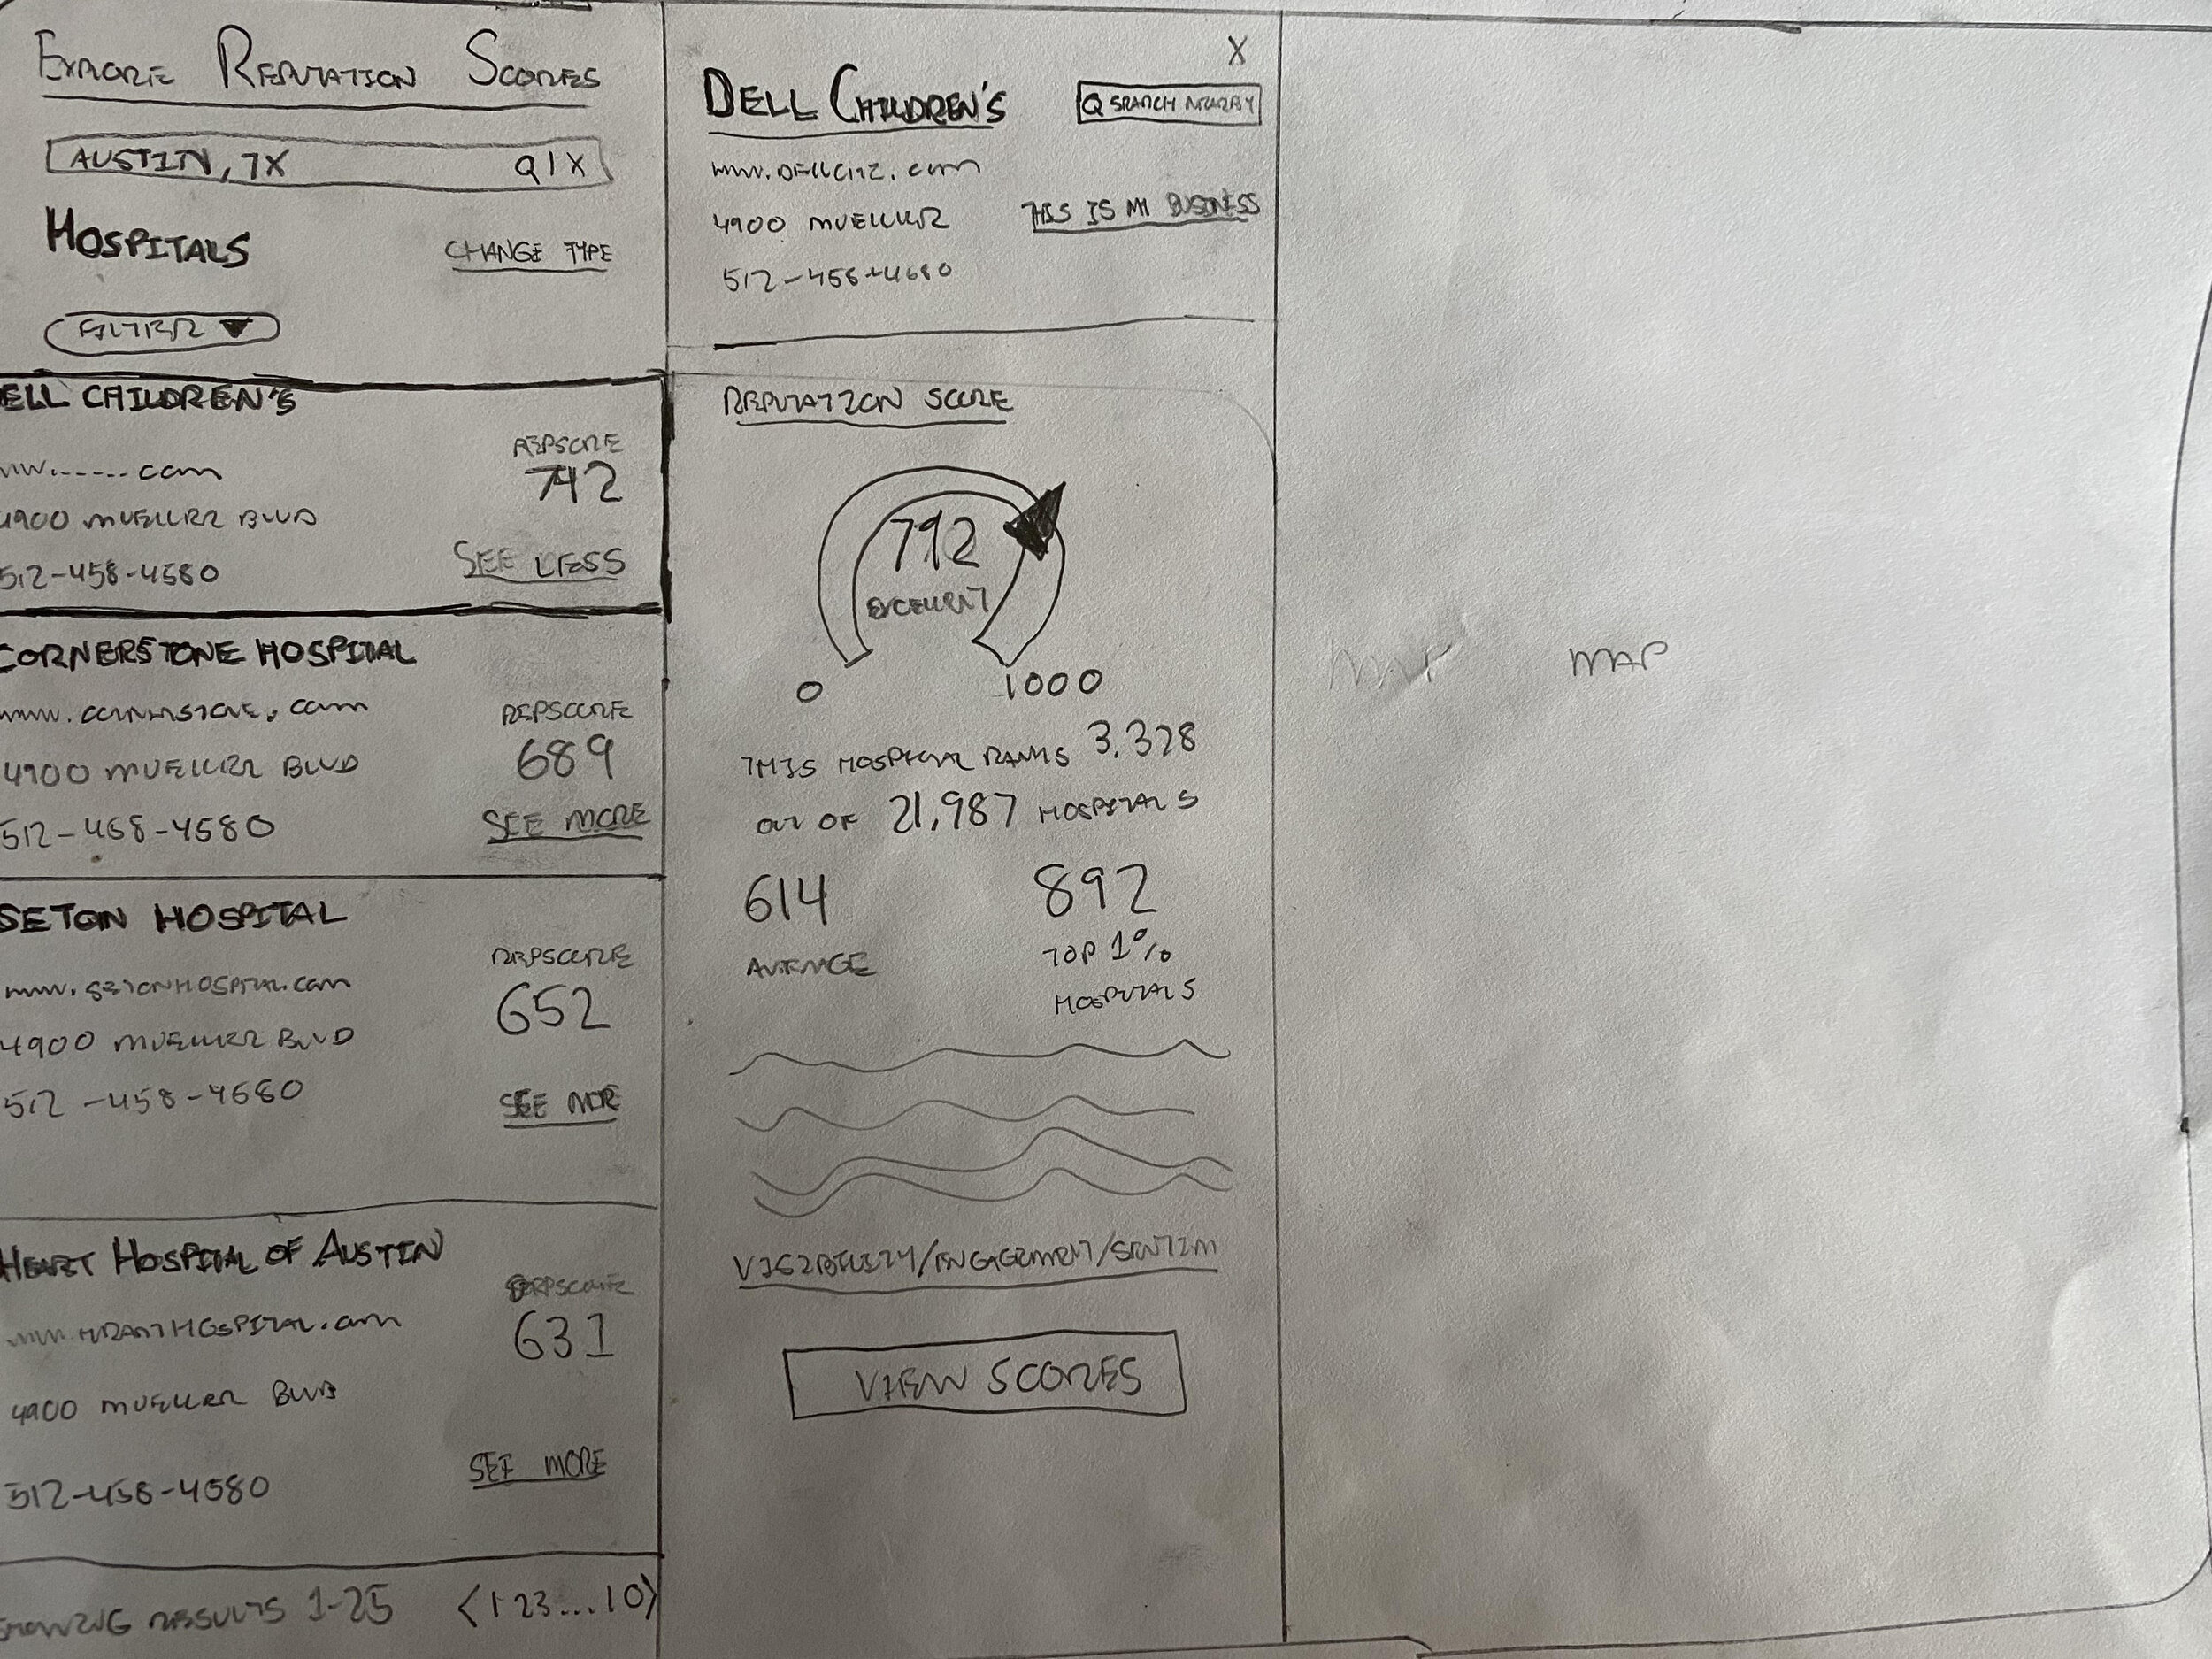
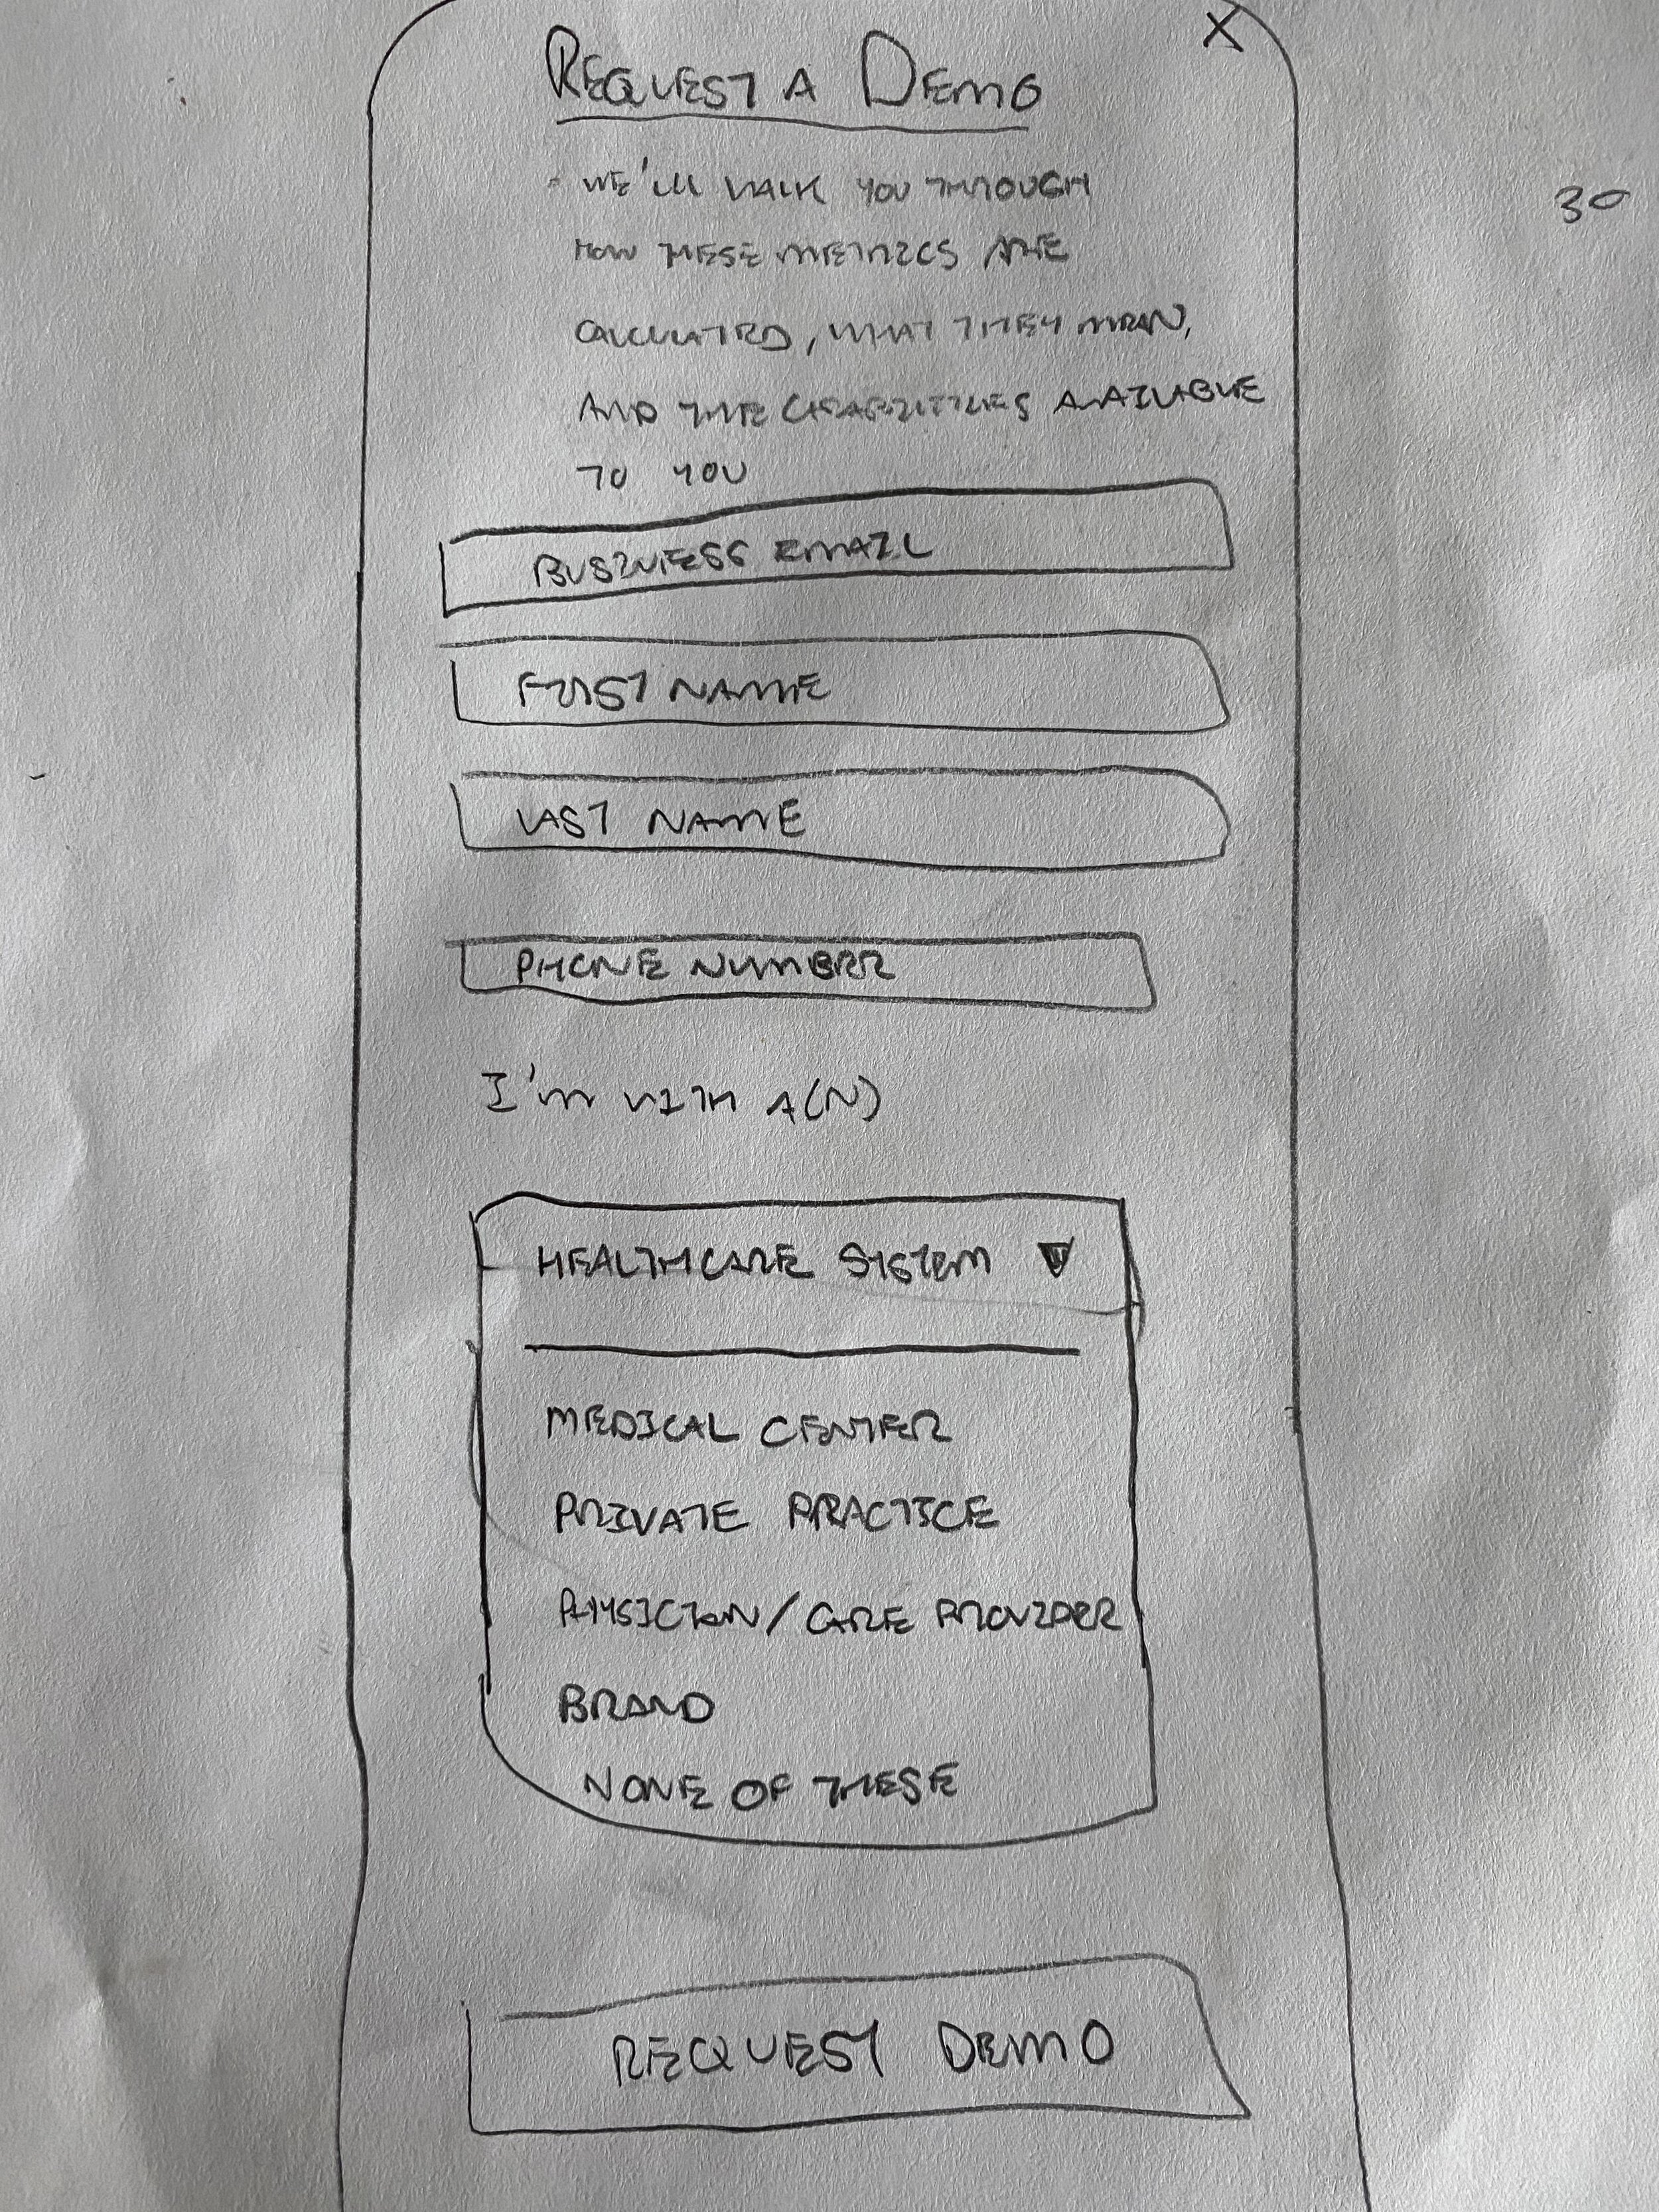
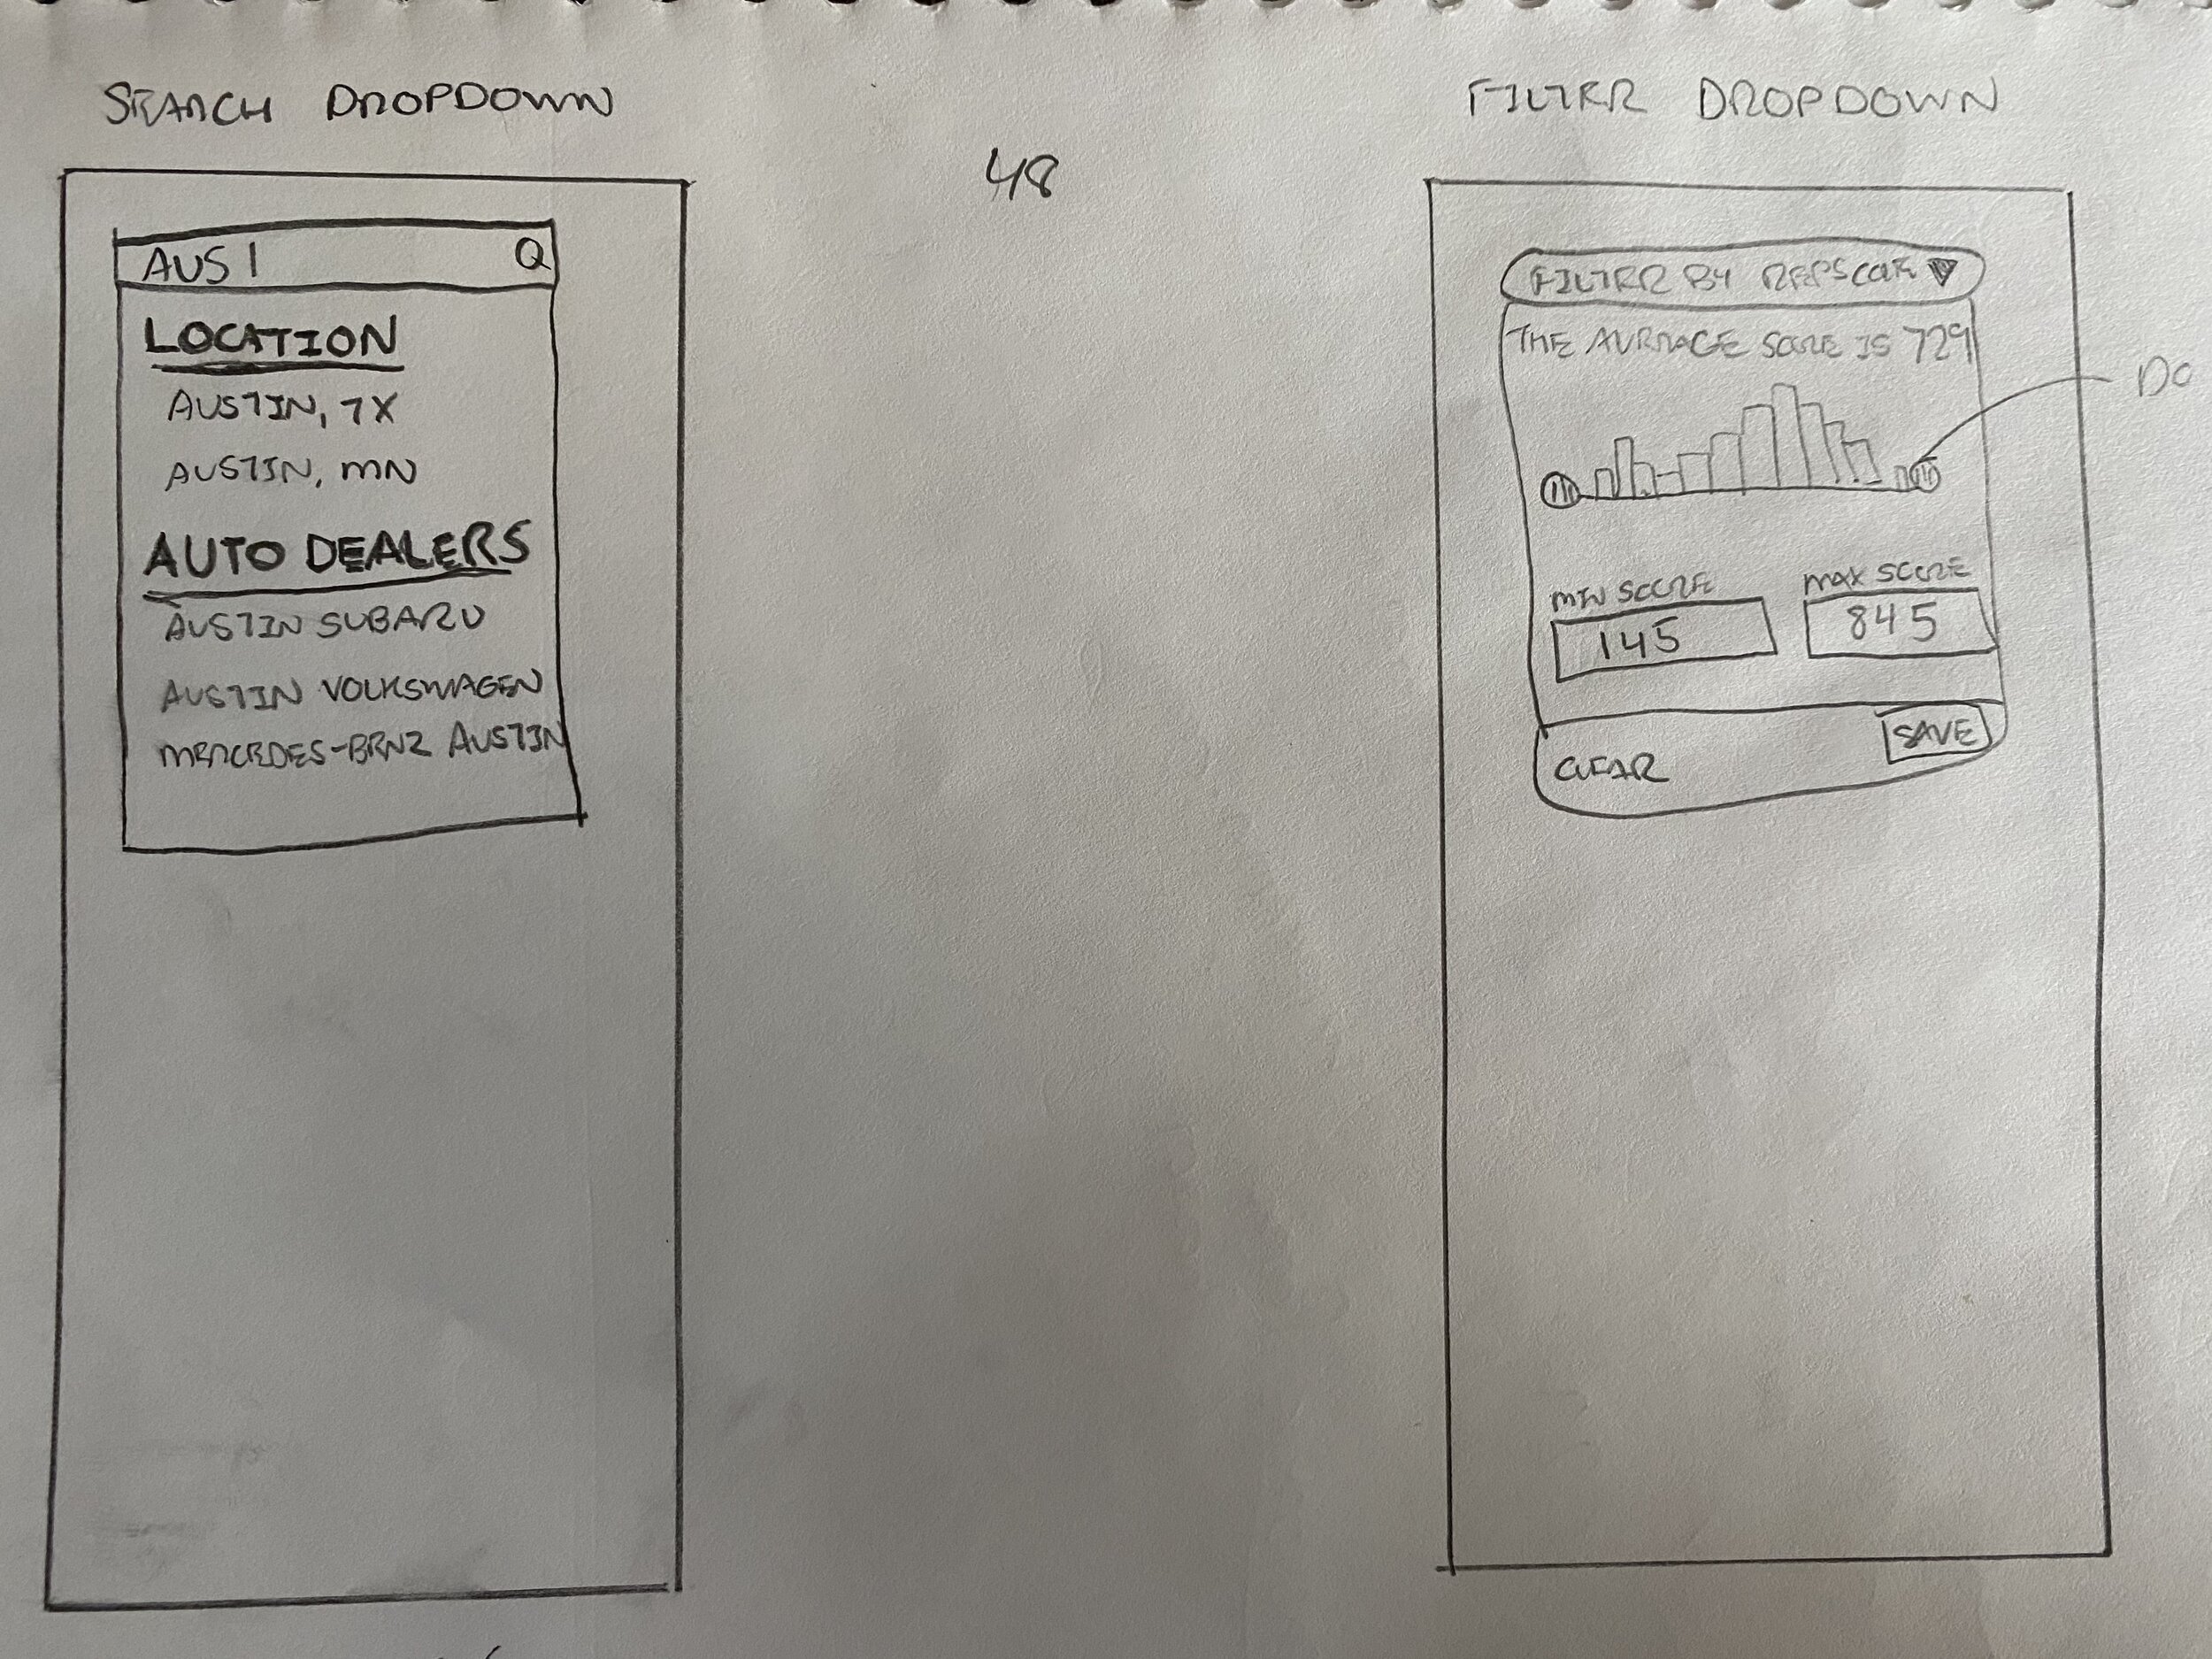
Wireframes
I used the wireframes to confirm direction and functionality with the client, as well as to gain clarity on the voice and tone to be used in the written copy.


Visual Design
I applied Reputation brand colors to the wireframes, as well as the use of a color gradient from green to red to show different levels of Reputation Scores indicating whether the score was considered to be good, bad, or average.


Strategic Recommendations
While the client provided direction and functionality upfront, I was able to make some recommendations to the client to implement instead for a better user experience.
Use a unified metric to describe secondary data
The Visibility, Engagement, and Sentiment scores are secondary pieces of data that feed into the Reputation Score. While the client wanted to have each score, which represented different fractions (i.e. Engagement Score out of 180, Visibility out of 50) displayed, I recommended displaying them as percentiles in order to present them in a unified format, to eliminate confusion for the user.
Displaying search results below the map on mobile
While the client intended that a user would only load one search result at a time by clicking on the map while using the tool on mobile, I recommended displaying 10 results below the map with the ability for the user to load more, similar to Instagram’s old method of displaying updates to one’s feed.
Lead Generation Dual Strategy
Rather than force all users to sign up for a demo just to consume more information, I recommended that lead generation forms be displayed in a generic manner with a checkbox for the user to opt-in to a demo, and a nurture campaign be created such that lead generation wouldn’t force the user to sign up for a demo and feel obligation to purchase paid access to the tool.
Takeaways
Given constraints of timeline and budget, technical feasibility of product requirements should be verified by development teams as early in the project as possible
This project represents my first professional experience of wearing both the hats for product management and product design
It is ideal to validate solutions and verify business-driven product requirements with users, but in the event that that isn’t possible, 3 things need to be clarified for successful product design
1. Vision - why are we building this product?
2. Functionality - what should it do?
3. Aesthetics - what should it look like?
Like what you see or want to chat? Please contact me.
raj@rssdesign.org
RSS Design © 2022
